The EBV Accuracy graph provides an indication of the possible change in EBVs for each trait. By definition, an EBV is an estimate of an animal’s true breeding value. The “accuracy” figure produced with each EBV provides a measure of the stability of the EBV and gives an indication of the amount of information that has been used in the calculation of that EBV. The higher the accuracy the lower the likelihood of change in the animal’s EBV as more information is analysed for that animal, its progeny or its relatives.
In the EBV Accuracy graph, the horizontal bar for each trait is a method of describing the magnitude of the possible change in the EBV ie the range within which the EBV is expected to vary with more performance information on the animal or its relatives. The bar represents the range in which there is a 67% statistical chance of where the true breeding value sits for this trait. Another way of looking at this is to consider that as more performance information is added for this animal, the EBV would be expected to fall within the EBV range displayed in the graph 67% of the time.
Further information on EBV accuracy can be found in the BREEDPLAN Tip Sheet on Understanding EBV Accuracy.
Of course, as the EBV takes into account all the pedigree and performance information that is available at this point in time, the EBV is also the most reliable indication available of the animal's breeding value for each trait at this point in time.
Within the display of the EBV Standard Graph:
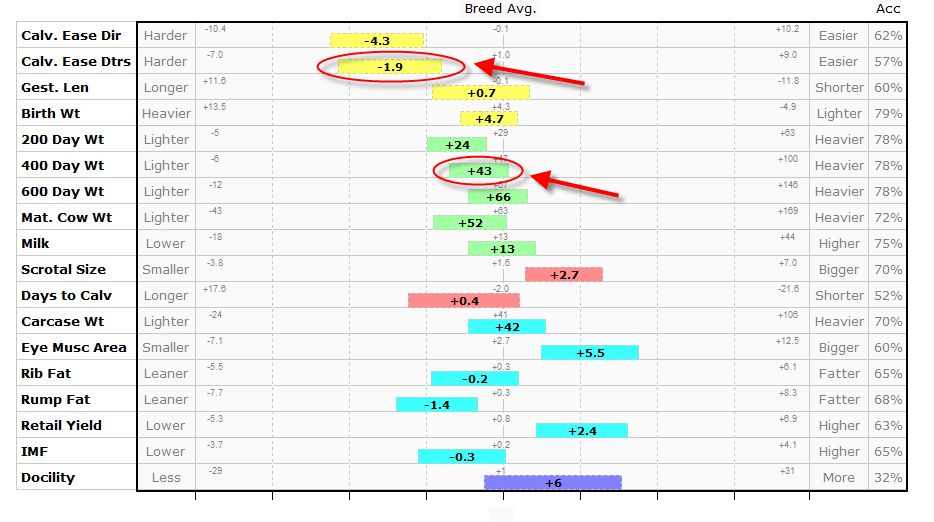
• The actual EBV Accuracy for each trait is shown at the right side of the graph.
• The Breed Avg values are listed in the centre of the graph and reflect the average EBVs of current animals within the breed (ie. all 2-year-old animals).
• The minimum and maximum EBV values displayed at the left and right of the graph for each trait represent four standard deviations (statistical measures of spread) from the current Breed Avg values, rather than the current minimum and maximum EBV values for the breed.
• The horizontal bar displays the actual EBV value and where the animal is placed in relation to the current animals within the breed for each trait. The width of the bar is set one standard deviation either side of the current EBV value, meaning that statistically, there is a 67% chance that the true breeding value for this trait will be within this range.
As an illustration of the interpretation of the EBV Accuracy graph, in the example below the animal’s 400 Day Wt EBV is of higher accuracy than its Calv. Ease Dtrs EBV and so there is less change expected in the 400 Day Wt EBV as additional information becomes available.